We want to wish you and your family a very happy holiday season and a prosperous and healthy New Year!
Enjoy the year end review by the guys at Jib Jab - very funny!
Friday, December 23, 2011
Friday, December 9, 2011
Year End Tax Planning Tips
While there's not a lot of time left before the end of the year, there are things you can still do to reduce your tax liability. A number of tax provisions end on December 31st of this year, so this will be your last chance to take advantage of them.
|
Friday, December 2, 2011
Smartest Guys In The Room
Many believe bond traders understand the economy better than equity traders and therefore are considered the smartest guys in the room. Large institutional bond investors pay very close attention to the economy and any factor that might affect interest rates. Equity investors also recognize that changes in bond prices provide a good indication of what bond investors think of the economy.
Since the global bond market is more than twice the size of the world' stock markets, stock investors pay attention to what bond traders see. Bond prices tend to rise and interest rates fall when there is greater perceived risk. Many portfolio managers will move money from stocks to bonds if they see greater risk in the future. Transferring cash from stocks to bonds adds to the downward pressure on stock prices and upward pressure on bond prices.
Below is a chart of the 20-year US Treasury Bond Fund. You can see in this chart that both the price of the bond fund and the trading volume moved higher in the first few weeks of August at the same time the Euro zone issues started to become more pronounced. It will be important to watch Treasury bond prices in the future for clues. If bonds continue to move higher in the coming weeks/months, bonds investors could be forecasting an economic slowdown or possible crisis in Europe. Conversely, if bonds prices decline in the coming weeks/months, it could be a good indication that both an economic slowdown and Euro zone crisis are much less of a worry - at least in the near to intermediate term.
Friday, November 18, 2011
Home Equity Line of Credit as First Mortgage
With the Federal Reserve stating that interest rates are expected to remain low until 2013 and possibly longer, there is an opportunity available to homeowners with a higher rate first mortgage. A homeowner could consider paying off their first mortgage (amortized loan) with a home equity line of credit (HELOC) or simple interest loan. Over the life of the HELOC one may save thousands in mortgage interest and pay off the balance of the loan much sooner.
First it is important to understand a HELOC. The term home equity line of credit is not interchangeable with the term "second mortgage." A "first" or "second" mortgage only refers to the loan's claim position, not its terms. HELOCs are often referred to as "second" mortgages because there is usually another mortgage against the property when they are taken out. If one were to default, the lender in second position would not see any money until after the lender in first position had been repaid. However, it is possible to have a HELOC in first position if there is no other mortgage on your home when you open a HELOC or you use the HELOC to pay off your first mortgage.
First it is important to understand a HELOC. The term home equity line of credit is not interchangeable with the term "second mortgage." A "first" or "second" mortgage only refers to the loan's claim position, not its terms. HELOCs are often referred to as "second" mortgages because there is usually another mortgage against the property when they are taken out. If one were to default, the lender in second position would not see any money until after the lender in first position had been repaid. However, it is possible to have a HELOC in first position if there is no other mortgage on your home when you open a HELOC or you use the HELOC to pay off your first mortgage.
Let's take a look at how a HELOC could work as a first mortgage. For our example, let's take a $200,000 30-year conventional loan at a fixed interest rate of 5.50%. For this loan the payment would be approximately $1,130 per month (roughly $900 interest and $230 principal in initial years). Total interest paid over the 30 year life of the loan would be roughly $208,000; more than the original loan. As we know, an amortized loan is mostly interest paid in the early years and mostly principal paid in the later years.
Currently interest rates on HELOCs are 3.00% or less in some cases. The interest rate of a HELOC is a simple interest calculation and is not amortized over a set period of time. Therefore, each payment toward principal reduces the next month’s interest expense. The interest rate is variable so if interest rates rise, the interest charged will increase and vice versa.
For example, a $200,000 home equity line of credit at 3.00% would require a minimum interest payment of roughly $500 per month; almost half of the interest paid on the convential 30-year loan. If one continues to make the same $1,130 payment each month toward a HELOC, which would result in a $630 payment to principal each month. If we assume the interest rate stays at 3.00%, the loan could be paid off in roughly 19 years and total interest paid would be $65,000; much less than the total interest paid on the same convential loan.
Even if interest rates increased by .25% each year (HELOCs have variable interest rates), the loan could be paid off in approximately 23 years with total interest paid of roughly $143,000; still much less than the original total interest amount on a conventional mortgage.
While converting a first mortgage to a HELOC may not be the best option for everyone because of the variability of interest rates; in an environment of low, steady interest rates a HELOC could be a great opportunity to pay down a mortgage more quickly versus a coventional 30-year mortgage. A HELOC is most attractive if a homeowner makes extra payments toward principal, which in turn reduces the monthly interest expense.
Friday, November 11, 2011
Super Committee Update
Below is an LA times article which came out today regarding the latest on the "super committee."
"With time and compromise slipping out of reach, the congressional "super committee" may punt its toughest deficit decisions to next year rather than strike a deal that would enrage both parties' political bases heading into the 2012 election. The Joint Select Committee on Deficit Reduction has until Nov. 23 to agree to a package that would reduce deficits by $1.5 trillion over the next decade.
Achieving that goal would require painful compromise — both parties would have to give up political weapons they have hoped to wield over the next year. But failure could roil the financial markets as the holiday shopping season begins and further trash the already record-low approval ratings for Congress.
In an effort to avoid stark failure, a fallback plan is emerging that would push tough decisions on taxes to next year, perhaps into a lame-duck session after the election, according to officials familiar with the panel's discussions.
Under this scenario, the two sides would agree now to a level of revenue from new taxes. They would direct the congressional tax-writing committees to revamp the tax code with fixed dates and goals. The object would be to generate new revenue while lowering corporate rates and keeping the top individual bracket no higher than the current 35%.
The move would allow the two sides to reach the outlines of the deal now, while deferring the most difficult issues until both see who wins the 2012 election. Currently, election politics makes an agreement difficult — each side has used the budget stalemate as a rallying cry and each believes it stands a chance of winning next November and thereby being able to strike a better deal. If voters deliver a clear verdict in November, Congress might be in a better position to come to terms.
"By kicking it into next year you're basically saying you're going to have this litigated in the next election," said R. Bruce Josten, executive vice president for government affairs at the U.S. Chamber of Commerce.
Even a limited deal, however, as it is being envisioned by those close to the secretive panel, would require substantial political give on the tax and spending issues that have come to define the modern political parties.
Democrats would have to allow sizable cuts to Medicare, Medicaid and other cherished domestic programs, and Republicans would need to loosen their signature anti-tax stance. Any discussion of an overall increase in revenues would probably violate the "no new taxes" pledge that most Republican members of Congress have signed, although a deal might be able to fuzz up the line enough that Republicans would not have to acknowledge having done so.
In proposals that have been exchanged so far, Democrats offered a package that would be made up of equal parts spending cuts and new tax revenues — but would push the tax component to next year.
Under that plan, a new set of "triggers" would be put in place that would be designed to automatically force tax-law changes if Congress failed to act.
No changes in Medicare or other entitlement programs would take effect until the tax changes were adopted.
The proposal was rejected by Republicans, who said the Democrats' insistence on $1 trillion in new revenue was a level they could not accept. They also said the proposed triggers would not be strong enough incentive to reach a deal. The GOP's own proposal offered $250 billion in new tax revenues, along with lower rates.
A deal presumably would have to fall between those two amounts.
Just as in the summer, getting to yes will require substantial give — particularly on the ratio of taxes to spending cuts — that could prove out of reach in the current political climate.
A compromise would assuredly result in an uproar on the political left and right, signs of which have already emerged. AARP is running ads warning lawmakers not to dare cut Medicare or Social Security. Top conservatives have made it clear that compromise on new taxes would be politically unforgivable.
Alienating so many important constituencies just as the 2012 campaign season is underway would be a tall order, even if the result could be followed by a grand political bargain. But with time running short, many in Congress are loath to walk away from the possibility of a history-making achievement. Never before, experts say, has one group of lawmakers been given as much power as the super committee wields. Any proposal the committee members agree to has a guarantee of an up or down vote in both houses of Congress, bypassing the Senate's ability to filibuster."
Friday, November 4, 2011
Risks Remain Elevated
Along with the news of an apparent final and comprehensive European solution last week was the the report that US GDP rose at an annual rate of 2.5% in the third quarter; higher than expected. Unfortunately, investors continued to follow the results of coincident and lagging indicators rather than leading indicators, so the positive GDP figure was taken as evidence that an oncoming economic downturn or slowdown was now "off the table."
We will emphasize that leading indicators are in fact leading evidence of the economy. As we know, past performance is not indicative of future results. For example, the ECRI Weekly Leading Index, which we discussed a few weeks ago, is continuing to point to a slowdown in growth. Of course, it's not a perfect indicator by itself, but its leading properties are useful. If you go back over the past few decades and look at the points where the index growth rate fell below zero, you'll find that weekly unemployment claims (a coincident indicator) were generally below the five-year average at that time and took 3 to 4 months before unemployment claims climbed over the long-term average.
So the tendency for investors to make predictions from data such as this current data can be dangerous. It allows investors to be sucked in by temporary reprieves in periods where very negative conditions persist. Despite the variability in short-term outcomes, and the tendency for the market to advance as the economy declines, the overall implications are usually negative in terms of risk/reward.
The same can be said here of economic prospects. Investors have almost entirely abandoned any concern about recession risk based on a few weeks of benign economic figures. Yet on the basis of indicators that have strong leading characteristics, a broad ensemble of evidence continues to suggest that recession risks still remain, and combinations of such indicators provide a basis for concern.
For example, since the early 1960's, when the ECRI Weekly Leading Index growth rate has been below -5, the economy has already been in recession approximately 80% of the time. If in addition, the S&P 500 Index was below its level of 6 months earlier, the economy was already in recession 87% of the time. Interestingly, when the index was below -7, and the S&P 500 was below its level from 6 months earlier, the U.S economy has been in a recession within 6 months, 100% of the time.
Now, we certainly don't base our economic expectations solely on these data points, as a broad array of other economic data points are mixed at the current time; however we want to be very aware of the data and historical statistical evidence. Therefore, we would view the sheer abandonment of a recession by the media, economists, as well as investors to be a bit misleading. Wall Street economists will quickly point to the summer of 2010, when the ECRI's Weekly Leading Index dropped below -10 without a subsequent recession, thanks we believe to the brief stimulative effect produced by QE2. Although the ECRI itself did not officially observe enough deterioration in its indicators to project a recession last summer. As we know it is currently projecting a U.S. recession in 2012 based on its leading indicators. To what degree is unknown at this time - it could be mild or more severe depending on outside shocks; or non-existent if the Federal Reserve steps in with another round of quantitative easing.
Given that nothing in economics is entirely certain, it's possible that this time will be different. We have seen a lot of firsts over the past few years. But that possibility is not one that has support in the data. To avoid a recession, we have to hope for an outcome other than the one that has historically occurred 100% of the time; given the current indicators. While we can't predict the future, it would seem prudent not to ignore this fact.
Friday, October 28, 2011
Quarterly Summary
The Federal Reserve's efforts to jump start the struggling U.S. economy dominated the quarter's headlines. In early August, the Fed announced it would hold short-term interest rates near 0% until at least mid-2013. The Fed's move accompanied a downbeat forecast in which it noted a depressed housing sector and deteriorating jobs market. The Fed acted again in September when it announced plans to sell $400 billion in short-term Treasury bonds in its portfolio by June 2012 and buy longer-term debt, a move aimed at further driving down long-term borrowing costs. The Fed also said it would maintain its investments in mortgage-backed debt at current levels, instead of paring its mortgage holdings as it has done over the past year, in an attempt to boost the ailing housing market. On a more negative note, the central bank noted "significant downside risks to the economic outlook, including strains in global financial markets."
At the end of August, the Commerce Department reported the U.S. economy grew at a 1.3% pace in the second quarter of 2011. However, other indicators continue to point to a sluggish economy. Job creation stalled in August, when the unemployment rate was stuck at 9.1% for the second straight month. Consumer confidence fell to multi year lows, as consumer worries about the weak jobs market and falling stock prices escalated.
Investor uncertainty has increased markedly in recent weeks, but we see reasons to be cautiously optimistic. We believe odds of an outright recession are around 50%, despite growing talk that the U.S. is sliding into another downturn; although the ECRI has officially called for a US recession in 2012. A more probable scenario is a "stealth growth recession" characterized by extremely low economic growth and high unemployment.
The situation in Europe remains a bit troublesome, as economic growth is slowing across the Eurozone, loan losses continue to pile up, and the risks of a banking crisis are growing. A Greek default looks increasingly likely; it seems to be just a matter of when. However, European policymakers appear to have finally grasped the gravity of the crisis, and we believe the odds are favorable that they will take sufficient action to prevent it from spreading.
While the news over the past several weeks has been fairly negative, the one thing missing from the constant cascade of worrying headlines is any hint of deterioration in US corporate earnings, at least at this point. Earnings estimates will need to be watched carefully in the coming weeks/months for signs of a slowdown. So far this month most earnings reports have come in better than expectations, which is a good sign for continued profitability by corporations. S&P 500 earnings estimates for 2011 are still hovering around $98.00 (up slightly from the first quarter); with continued expectations for roughly $108.00 in 2012.
Friday, October 14, 2011
Headline Risk
Over the past few months, there has been an abundance of negative press regarding the credit concerns over in Europe. These concerns triggered a nasty spillover effect here in the United States, leading to increased pessimism and greater negative sentiment within the markets. As a result, we’ve seen stock prices decline from late July/early August and have since been trapped in a volatile trading range. Meanwhile, more news continues to spread. Last week Fitch downgraded both Italy and Spain. We saw domestic activity similar to this back on August 5th when S&P downgraded the United States. Though it was a trivial act, the broad market sold off sharply. Over the next few days, we witnessed some of the most pronounced swings in market history which spawned even higher levels of uncertainty and negative sentiment among investors.
This is a classic example of headline risk that investors will inevitably face, (especially during volatile times like this). What investors need to be reminded of is the fact that nothing fundamental changed from one day to the next, and still the market went into a tailspin. This pertains to both the United States and Europe. A rating agency came out and offered their new “opinion” about a nation’s ability to deal with their current debt level. Keep in mind these are the same rating agencies that triple stamped mortgages for the majority of an entire decade only to help spawn the housing and financial meltdowns.
The point is that in situations like these, the cooler heads will often prevail. The “sell everything” mentality is nerve wracking and often shows up at just the wrong time. Emotions tend to get the best of us and acting on them, especially when it comes to investing, is never a prudent strategy. If a slight change or adjustment to your account is in order, keep it simple. Remember, it’s good to pay attention to what’s going on in the markets, but don’t let too many front page articles get the best of you or your investments.
Friday, October 7, 2011
Anti Wall Street Protests
Over the past few weeks, large numbers of young Americans have been gathering at Wall Street in NYC in an OccupyWallStreet movement. Caroline Baum from Bloomberg News wrote a very interesting column this morning about the movement. I think the movement addresses a number of concerns and the article is insightful is showing what we could expect in the coming weeks and months. Link to article is below -
http://www.bloomberg.com/news/2011-10-07/anti-wall-street-protests-ignore-legitimate-gripe-caroline-baum.html#disqus_thread
http://www.bloomberg.com/news/2011-10-07/anti-wall-street-protests-ignore-legitimate-gripe-caroline-baum.html#disqus_thread
Friday, September 30, 2011
What Is Happening?
The number one question we usually get asked (at least lately) is "what is going on with the markets?" Although a simple question, it's actually a really good question. In an environment where we continue to see massive upside moves followed by massive downside moves as well as very large intraday swings - both in domestic markets and those around the globe.
We believe there is a simple answer. Right now there are just too many outside influences and external factors playing on the collective emotions of market participants. Here is what the last month or so has sounded like:
In over 20 years in the business, I have never seen such market interference and involvement by governments on a day to day basis. One government leader states one thing, another government leader says another, and then our government leaders say something completely different. Until this dynamic changes, we should expect more of the same. The longer the dynamic continues the worse it is for the capital markets and world economies.
The good news is that eventually, when all is said and done, the global markets will eventually move in the direction they intended to go - which unfortunately in our opinion may be lower, as the increase in volatility is making investors more nervous and economic data continues to show a slowdown in global growth. Just this morning the ECRI stated on CNBC that its indicators were saying the US is heading into another recession. And this group has been very accurate in the past. The video clip can be viewed by clicking on the link below.
http://www.businesscycle.com/#
It our opinion it is best to continue to be defensive oriented and wait until there is more clarity on both the government involvement as well as economic front.
We believe there is a simple answer. Right now there are just too many outside influences and external factors playing on the collective emotions of market participants. Here is what the last month or so has sounded like:
- We will default on our debt if the debt ceiling isn't raised.
- Greece is saved...no it's not...it's saved...maybe not...
- Germany is going to leave the Euro.
- Italian banks are in big financial trouble.
- The Fed is going to do this...the Fed is going to do that...
- The US economy is slowing down.
In over 20 years in the business, I have never seen such market interference and involvement by governments on a day to day basis. One government leader states one thing, another government leader says another, and then our government leaders say something completely different. Until this dynamic changes, we should expect more of the same. The longer the dynamic continues the worse it is for the capital markets and world economies.
The good news is that eventually, when all is said and done, the global markets will eventually move in the direction they intended to go - which unfortunately in our opinion may be lower, as the increase in volatility is making investors more nervous and economic data continues to show a slowdown in global growth. Just this morning the ECRI stated on CNBC that its indicators were saying the US is heading into another recession. And this group has been very accurate in the past. The video clip can be viewed by clicking on the link below.
http://www.businesscycle.com/#
It our opinion it is best to continue to be defensive oriented and wait until there is more clarity on both the government involvement as well as economic front.
Friday, September 23, 2011
Weekly Update
Below is excerpt from recent market commentary from the managers of the Marketfield fund.
US economic data remains squishy, but not as straightforwardly weak as consensus imagines. Perhaps most importantly non-financial earnings continue to produce positive surprises with a number retail and technology stocks reporting better than expected earnings in recent days. The Federal Reserve Board however seems to have capitulated to the fears of downside pressure issuing a decidedly downbeat statement on Wednesday that unnerved the US equity market.
As to their decision to intervene in the long end of the treasury curve this was expected but is unlikely to have a significant effect other than possibly collapsing the wide spread between the 10 and 30 year bond. As we have stated before, US monetary policy is already extremely stimulative and further embroilment of the Federal Reserve into the yield curve was an unnecessary complication. No doubt the well meaning members of the FOMC felt the need to be seen to be doing something, and at least have chosen a path that is unlikely to make matters worse.
Even after the abrupt decline on Wednesday afternoon the SPX remains in the middle of its trading range and with the exception of financial stocks, a large number of which made new post 2009 lows, most sectors remain well above key support although some may end up testing this during what looks to be a difficult week for stocks. The Nasdaq Index continues to look much better and actually broke above its 200 day ma before being pulled lower on Wednesday.
Even so the index remains in positive territory for 2011, and is the only large global index to be able to make this claim. The out performance by the NDX remains the most interesting aspect of the long corrective phase and we would be building positions in this index during the current pullback. The small cap Russell 2000 index has shown none of the defensive qualities of the larger cap indexes and we would be avoiding this area of the US equity market.
This takes us to Europe, where a hurried announcement regarding the provision of emergency US Dollar auctions last Thursday at least bought some time for the beleaguered institutions that were at risk of being choked out of funding markets. Unfortunately the first week has been frittered away without other progress being made other than a widening of collateral accepted by the ECB. The danger of a further sharp dislocation by the market has not been averted by either of these moves and a far more radical change of tack is still urgently required. The only question in our minds is whether a narrow portion of the US equity market can start to detach itself from Europe's woes and start to make steady progress in the absence of a solution being hammered out across the Atlantic Ocean. This seems unlikely if things are allowed to proceed to a full-blown crisis, but a longer process of muddling through could potentially create some great opportunities in a number of US sectors.
Friday, September 16, 2011
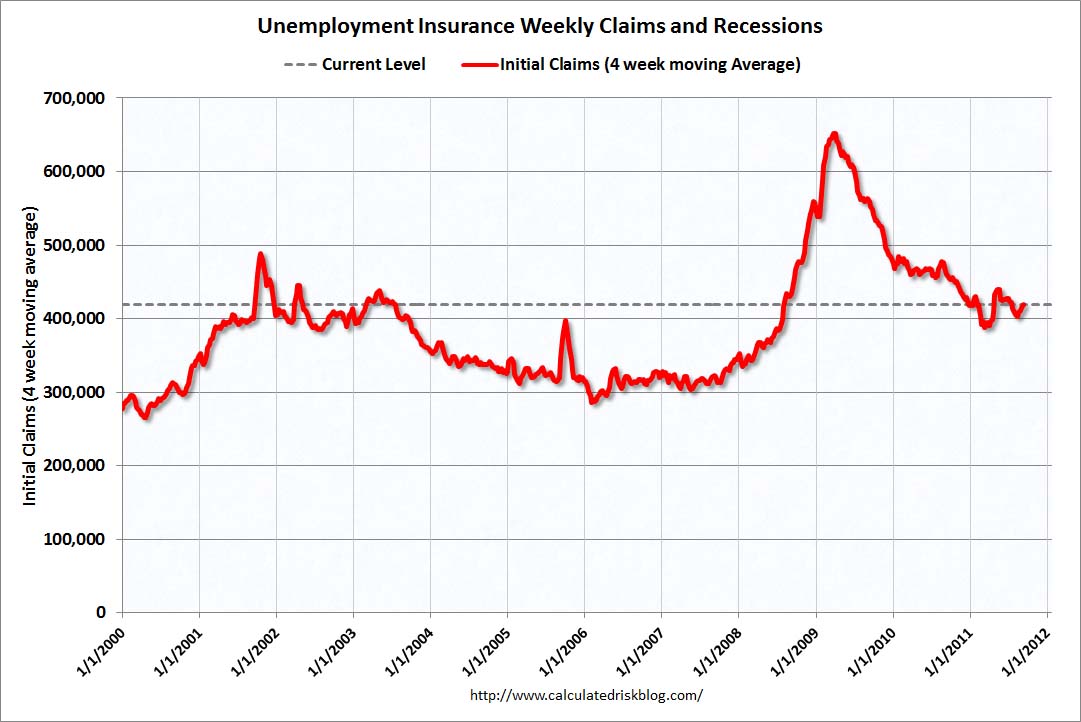
Unemployment Rate Shows No Improvement
State unemployment rates were generally little changed in August. Twenty-six states and the District of Columbia reported unemployment rate increases, 12 states recorded rate decreases, and 12 states had no rate change, the U.S. Bureau of Labor Statistics reported.
Nevada continued to report the highest unemployment rate among the states, 13.4 percent in August. California posted the next highest rate, 12.1 percent. North Dakota registered the lowest jobless rate, 3.5 percent, followed by Nebraska, 4.2 percent.
New Mexico registered the largest jobless rate decrease from August 2010 (-1.9 percentage points). Four additional states reported smaller but also statistically significant decreases over the year: Oklahoma (-1.4 percentage points), Indiana (-1.3 points), Oregon (-1.1 points), and Florida (-0.9 point). Forty-five states recorded unemployment rates that were not appreciably different from those of a year earlier.
The fact that 45 states and the District of Columbia have seen little or no improvement over the last year is a reminder that the unemployment crisis is ongoing and could be for some time.
In related news, the Department of Labor stated that in the week ending September 10, the advance figure for seasonally adjusted initial claims was 428,000, an increase of 11,000 from the previous week's figure of 417,000. The 4-week moving average was 419,500, an increase of 4,000 from the previous week's revised average of 415,500. See chart below -
Friday, September 9, 2011
Bubble Comparison Chart
Over the course of the past 30 years, the world has seen several "bubbles" emerge. Below is a chart we call a "bubble comparsion" chart. The chart compares Japan's stock market bubble in the 1980's, the technology stock bubble in the US in the late 1990's, China's stock market bubble of 2007, crude oil bubble of 2008, and the current state of gold in 2011. We offer this chart so you can see what happens on the other side of euphoria.
Ironically, a recent Gallup poll shows that over 35% of Americans believe gold is the single best long term investment for the next decade; higher than real estate, stocks, bonds, and savings accounts. Although not referenced on this bubble chart, would you like to guess what 38% of Americans believed was the best long term investment in April of 2007?
Real Estate. It is truly amazing how often history repeats - just never in the exact same way.

Thursday, August 11, 2011
Friday, July 22, 2011
Second Quarter Update
After another three months of volatility, the major market averages didn’t move much in the second quarter, ending right about the same levels as the end of March. If it weren't for the last three days of the quarter, the markets would have been down a few percent. The Dow Jones Industrial Average declined (0.77%) for the quarter; the Nasdaq Composite declined (0.27%); the Russell 3000 Index was unchanged; and the S&P 500 declined (0.39%), excluding dividends. International markets, as measured by the MSCI EAFE Index, actually rose 1.83% during the quarter. The Barclays Capital Aggregate Bond Index was the big standout, increasing 2.29% during the quarter.
While the news over the past several weeks has been fairly negative, the one thing missing from the constant cascade of worrying headlines is any hint of deterioration in US corporate earnings, outside of the financial sector which has a separate set of problems. This doesn’t insulate the US stock market from the possibility of increased volatility in in the short term in reaction to news, but the overall recovery is likely to remain positive. So far this month most earnings reports have come in a bit better than expectations, which is a good sign.
Friday, July 15, 2011
The Debt Ceiling - A historical look back
The current debt ceiling battle is the topic du jour in Washington. The Republicans, influenced by the Tea Party, argue that simply raising the debt ceiling over and over again is an unsustainable policy, so they're insisting on budget cuts or no deal will get done. Many Democrats agree that the U.S. has a deficit problem, but they stress the necessity of raising the debt ceiling promptly in order to prevent default or problems funding other U.S. obligations. With all this arguing about “to raise or not to raise” we thought it might be informative to take a look at the past.

Depending how high Congress raises the ceiling in coming months, it could potentially surpass 100% of our nation’s GDP. It would take at least a $700 billion increase: currently the ceiling is set at $14.3 trillion and would have to be a little greater than $15 trillion to move past the annualized GDP estimate. The last time Congress raised the debt ceiling, in February 2010, it increased the limit by almost $2 trillion.
In the end, a decision comes down to a determination of whether the potential harm of the budgetary cuts necessary to avoid raising the ceiling are worth the risk they pose to the U.S. economic recovery. But history does help show that longer-term fiscal reform is needed to cure Congress of its addiction to debt.
The debt ceiling was first set in September 1917. At that time, Congress authorized the issuance of about $7.5 billion in U.S. bonds and another $4 billion in certificates of indebtedness, under the Second Liberty Bond Act. How much was $11.5 billion dollars back then adjusted for inflation? In March 2011 dollars, it would be roughly $193 billion. Currently, the debt limit is set at $14.3 trillion -- so inflation doesn't tell the whole story! To be sure, Washington's love affair with debt has grown tremendously over the past 25 years.
So first, here's the debt limit throughout history, charted along with actual U.S. debt outstanding:

The chart shows that the debt ceiling (thick red line) didn't even hit $1 trillion until 1982 -- less than 30 years ago. Since then, it's increased exponentially. Of course actual debt outstanding (thin green line) moves right in sync with the actual debt ceiling, as it generally only rises when the government decides to issue more debt.
You can see the ceiling is a sort of step function, as it increases based on Washington's whims, not a natural mechanism. This chart also shows that increases in the debt ceiling are quite common. Over the 94-year period, the debt ceiling has been revised 102 times. Depending how high Congress raises the ceiling in coming months, it could potentially surpass 100% of our nation’s GDP. It would take at least a $700 billion increase: currently the ceiling is set at $14.3 trillion and would have to be a little greater than $15 trillion to move past the annualized GDP estimate. The last time Congress raised the debt ceiling, in February 2010, it increased the limit by almost $2 trillion.
In the end, a decision comes down to a determination of whether the potential harm of the budgetary cuts necessary to avoid raising the ceiling are worth the risk they pose to the U.S. economic recovery. But history does help show that longer-term fiscal reform is needed to cure Congress of its addiction to debt.
Friday, July 8, 2011
"Twinkie Market"
In an interview with Jason Zweig at the end of last year, Seth Klarman, a legendary Boston-based hedge fund manager known for his astute investment management skills, called this "a Twinkie market." He went on to say that “It is fun and tasty, but all the ingredients are artificial.” We would add that Twinkies aren't really good for you either. We believe this analogy rings even more true today than it did at the end of 2010. The simple truth is that by holding interest rates at an effective 0% level, the Federal Reserve has executed a forced asset allocation liquidity trade. To earn a return on your cash and keep pace with inflation an investor has to increase his/her risk levels by moving into riskier assets. Money that was in savings accounts or other fixed-rate investments like CD’s, has found its way to the stock market or other investments looking for some rate of return.
Mr. Klarman went on to say that he was more worried about the world than he had ever been in his career. He stated that the global and domestic risks keep increasing with each passing month. European sovereign debt is the most obvious problem as it has dominated the recent headlines. Europe is trying to “kick the can down the road” with the current Greek situation, but other countries, including Italy, Portugal and Spain, also face potential debt problems. In recent weeks, we have seen the protests in Greece on television, and perhaps we will see them repeated in other nations as they must face difficult choices to deal with their own financial conditions.
Here at home, the risks include political posturing surrounding the debt ceiling for the federal government and severe funding problems for many state and local governments. We recently read an article about the U.S. needing to take its own austerity measures at some point in the future. We believe this is entirely possible in the years ahead.
So with a renowned hedge fund manager worried, the prospect of a further debt crisis in Europe, and debt issues here in the U.S., shouldn’t the global markets be reacting to this bad news and moving significantly lower? The simple answer is yes. But the reality is that these concerns/issues don’t matter until they do matter. As long as the current problems don’t prevent companies from increasing revenues and earnings (which hasn’t happened yet) the problems don’t matter. At some point they probably will matter, but at the moment they don’t.
This doesn’t mean one should totally disregard the news entirely because understanding the macro economic trends are important; but the global markets, while subject to news-based volatility, will tend to follow the underlying trend of economic activity and earnings rather than the headline news. And so far the trend of economic activity and earnings has been positive, albeit at a slow rate.
Friday, July 1, 2011
Widgets for the Weekend
Happy Fourth of July! Please enjoy the weekend -
With all of the talk of austerity in Greece (and other European countries), congress dealing with our own debt ceiling limit, and the grumblings about the high price of gas, we want to share some interesting widgets we found. The data updates in real-time (or close to it). The numbers speak for themselves!
With all of the talk of austerity in Greece (and other European countries), congress dealing with our own debt ceiling limit, and the grumblings about the high price of gas, we want to share some interesting widgets we found. The data updates in real-time (or close to it). The numbers speak for themselves!
Friday, June 24, 2011
More of the same?
As we conclude an interesting week in the market, we will point out that so far, this year has some resemblance to what happened in the beginning of last year. The stock market began both years in a steady uptrend. 2010 slipped a little in late January and early Feb with about a 10% correction, but then went on to rally for two months straight, (up to the late April highs). From that point on in 2010, we saw a lot of “chop” in the market through the summer until September when energy stocks finally pulled the market into the next leg up after August and through the rest of the year. This year, the uptrend continued straight though until mid-February, before slipping from roughly 1340 to 1250 on the S&P. The earthquake in Japan was part to blame for this. Since then, we have seen decent earnings reports accompanied with some very disappointing macro-economic data. The housing market took another step back and further dragged on hopes for better US GDP Growth. At the same time, unemployment data came in weaker than expected. The Greece/European debt turmoil hasn’t helped things either. Then just out this morning, orders for U.S.-made durable goods partially rebounded in May after a steep decline in April. Durable-goods orders rose 1.9% in May after a downwardly revised 2.7% fall in April. The increase in May was slightly stronger than expected. Transportation orders had the biggest increase last month. Excluding transportation, orders rose 0.6%. Shipments rose 0.3% in May. Orders for core capital goods rose 1.6% in May after a 0.8% fall in April. Could it be that we are in for some more of the same “chop” through the summer? Hard to tell at this point, but so far it looks like things are shaping up that way.
 Jan-Jun 2010
 Jan -June 2011
 Jan-Jun 2010
 Jan -June 2011
Friday, June 17, 2011
Earnings Estimates Remain Intact
While continued concern in the Middle East, worries over debt crisis in Greece and greater Europe, and underwhelming economic numbers are giving investors cause for concern, it is important, from time to time, to take a step back from the news headlines. Ultimately, the markets, both foreign and domestic, will follow the trend of corporate earnings. If earnings are growing, markets tend to rise over time. If earnings are declining, markets tends to fall over time. Also, markets tend to discount future earnings by either moving up or down in anticipation of what may happen. Therefore, we want to periodically review earnings to see if earnings estimates are being adjusted upward or downward by analysts who follow the companies. Of course, analysts tend to often be late in making adjustments either up or down, so what we really want to follow is the trend of earnings estimates - are they trending higher, trending lower, or staying roughly the same.
Given the domestic markets have declined since the beginning of May, we would expect to see earnings estimates start to trend downward over the past month and moving forward. Let's take a look at earnings estimates for the S&P 500 as a whole and broken out by sector since the end of last quarter. The aggregate top line number (first line) doesn't equal the total of the numbers below that number because companies can be in multiple sectors.
As you can see with the list above, with the exception of Financials most sectors have seen earnings estimates increase since last quarter or in some cases, like utilities and healthcare, revised slightly lower. As of June 1st, only a few sectors have seen a decrease from May 1st estimates. So while the markets have declined, earnings have not in aggregate. The overall number for the S&P 500 (top line) has continued to move higher for 2011 and also 2012 (estimates not shown but currently stand at $111.82 for the index, up from $110.29 in April).
If estimates trend lower in the coming weeks, the recent downturn in the markets is most likely adjusting to the probability of slower earnings growth this year and that adjustment would be considered normal. However, if estimates continue to stay roughly the same and not trend lower (which we believe is likely), we could have a divergence from market expectations and actual earnings, which could send the markets into undervalued territory and create opportunities in certain sectors. Earnings will be the key focus in the weeks ahead, especially in July when actual earnings for the second quarter are released.
Given the domestic markets have declined since the beginning of May, we would expect to see earnings estimates start to trend downward over the past month and moving forward. Let's take a look at earnings estimates for the S&P 500 as a whole and broken out by sector since the end of last quarter. The aggregate top line number (first line) doesn't equal the total of the numbers below that number because companies can be in multiple sectors.
| 1-Jun | 1-May | 1-Apr | ||||
| S&P 500 | 97.88 | 97.21 | 96.99 | |||
| S&P 500 Consumer Discretionary (Sector) | 20.48 | 20.31 | 20.10 | |||
| S&P 500 Consumer Staples (Sector) | 21.53 | 21.43 | 21.30 | |||
| S&P 500 Energy (Sector) | 48.78 | 43.05 | 43.04 | |||
| S&P 500 Financials (Sector) | 16.65 | 17.73 | 18.21 | |||
| S&P 500 Health Care (Sector) | 32.47 | 32.92 | 32.77 | |||
| S&P 500 Industrials (Sector) | 20.87 | 20.83 | 20.52 | |||
| S&P 500 Information Technology (Sector) | 30.90 | 31.10 | 30.65 | |||
| S&P 500 Materials (Sector) | 17.89 | 17.33 | 16.92 | |||
| S&P 500 Telecommunication Services (Sector) | 7.81 | 7.69 | 7.75 | |||
| S&P 500 Utilities (Sector) | 12.78 | 12.86 | 12.85 | |||
As you can see with the list above, with the exception of Financials most sectors have seen earnings estimates increase since last quarter or in some cases, like utilities and healthcare, revised slightly lower. As of June 1st, only a few sectors have seen a decrease from May 1st estimates. So while the markets have declined, earnings have not in aggregate. The overall number for the S&P 500 (top line) has continued to move higher for 2011 and also 2012 (estimates not shown but currently stand at $111.82 for the index, up from $110.29 in April).
If estimates trend lower in the coming weeks, the recent downturn in the markets is most likely adjusting to the probability of slower earnings growth this year and that adjustment would be considered normal. However, if estimates continue to stay roughly the same and not trend lower (which we believe is likely), we could have a divergence from market expectations and actual earnings, which could send the markets into undervalued territory and create opportunities in certain sectors. Earnings will be the key focus in the weeks ahead, especially in July when actual earnings for the second quarter are released.
Friday, June 10, 2011
Smart Money More Confident
We haven't looked at sentiment data since earlier this year when dumb money sentiment was very high and smart money sentiment was low. At that time we said the risk/reward setup was not favorable based on historical precedent.
The most recent sentiment data from our friend Jason Goepfert at SentimenTrader.com shows just the opposite occurring today. The smart money is becoming more confident as the market moves lower while dumb money is becoming less confident.
While markets can continue to move lower in the near term, when smart money confidence rises close to or above 70 (which it rarely does), the risk/reward setup is extremely favorable for investors in the short to intermediate term. And of course, one wants to act in concert with smart money investors, even when emotionally it doesn't "feel" right. We believe more downside action in the indices, coupled with higher smart money confidence readings will likely provide solid, low risk, opportunities.

Friday, June 3, 2011
Weekly Update
This week's update is courtesy of our friends at Oscar Grouss Management.
"Our contention that the second leg of the corrective phase is underway certainly looks to be more reasonable after a very ugly session on Wednesday took the SPX index back down to key short term support. As we had explained, the combination of month end allocations and a late Memorial Day holiday were likely to obscure matters for a period of time but a very poor start to the May data cycle saw confidence crack in the US equity market and the largest one day decline recorded since the start of the strong rally last August.
As has been the case for several weeks, the brunt of the sell off was borne by financial stocks. It is our belief that these losses will not be quickly recovered and that large cap financials are being re-rated following an appreciation that recent legislative changes are likely to meaningfully downgrade their profitability going forward. This is particularly true of large, diversified institutions that have mixed principal and customer businesses under one conflict-ridden roof.
Within the core US equity market we still expect losses to be relatively contained and it is quite possible that the low point will be at or above that reached in mid March when the SPX traded just below 1250. A breach of this level would imply a deeper corrective move (1180 being the next clear support level) but as we always say, the least important number in a corrective move is its low point, the most important is the probability that the losses incurred will be recovered reasonably quickly. It is really this understanding that leads us to be patient with US equity exposure as opposed to emerging markets that we believe may be tracing out a terminal top to their ten year economic cycle. It should therefore be noted that the end of May saw much less sign of investor flows into the emerging market equity complex than recent months.
May’s overall losses were trimmed but this remains a very challenging start to 2011 for most equity markets. However, thus far investors seem to merely be switching their attention from equity to corporate credit. This is important since it has neutralized the effect of equity outflows on the currencies of many emerging markets. We doubt whether this balancing act will be able to stay in place much longer, and would look for one or more emerging market currencies (our favorite candidate being the Turkish Lira) to break down during the current cycle.
"Our contention that the second leg of the corrective phase is underway certainly looks to be more reasonable after a very ugly session on Wednesday took the SPX index back down to key short term support. As we had explained, the combination of month end allocations and a late Memorial Day holiday were likely to obscure matters for a period of time but a very poor start to the May data cycle saw confidence crack in the US equity market and the largest one day decline recorded since the start of the strong rally last August.
As has been the case for several weeks, the brunt of the sell off was borne by financial stocks. It is our belief that these losses will not be quickly recovered and that large cap financials are being re-rated following an appreciation that recent legislative changes are likely to meaningfully downgrade their profitability going forward. This is particularly true of large, diversified institutions that have mixed principal and customer businesses under one conflict-ridden roof.
These we expect to see centered on the financial and commodity related sectors in the US and the emerging market complex outside. We would also be concerned about any individual issues that have become particularly linked with emerging market growth.
Within the core US equity market we still expect losses to be relatively contained and it is quite possible that the low point will be at or above that reached in mid March when the SPX traded just below 1250. A breach of this level would imply a deeper corrective move (1180 being the next clear support level) but as we always say, the least important number in a corrective move is its low point, the most important is the probability that the losses incurred will be recovered reasonably quickly. It is really this understanding that leads us to be patient with US equity exposure as opposed to emerging markets that we believe may be tracing out a terminal top to their ten year economic cycle. It should therefore be noted that the end of May saw much less sign of investor flows into the emerging market equity complex than recent months.
May’s overall losses were trimmed but this remains a very challenging start to 2011 for most equity markets. However, thus far investors seem to merely be switching their attention from equity to corporate credit. This is important since it has neutralized the effect of equity outflows on the currencies of many emerging markets. We doubt whether this balancing act will be able to stay in place much longer, and would look for one or more emerging market currencies (our favorite candidate being the Turkish Lira) to break down during the current cycle.
We would also expect to see continued strength for both US treasuries and the US Dollar. The former area is starting to look a little expensive, with the 10 year yield now well below 3.00%, but we would be patient with any long positions for the time being. As we have seen before, long dated treasury yields can fall well below any fundamentally justified level in a corrective move and both the 10 and 30 year yield would seem to have further to run. The US Dollar on the other hand continues to look remarkably cheap. At the very least the DXY (dollar index) should be able to rally up to its declining 200 day ma (77.87) with a more ambitious target being the December 2010 high just above 81."
Friday, May 20, 2011
Currencies As A Hedge
In the aftermath of the global credit crisis, it has been hard to find truly uncorrelated asset classes in the capital markets. Uncorrelated investments are a way to protect against downside risk. However, since many asset classes continue to move in the same direction simultaneously, it has become increasingly difficult to find those assets that exhibit such uncorrelated behavior. The hard currency asset class may fill this void. The currency asset class has historically displayed low correlations to traditional asset classes, such as stocks, bonds, and commodities, and offers potential profit opportunities given its unique market structure. Therefore, the addition of a currency component to a portfolio may deeply enhance the risk/return profile over time.
During the run-up to the credit crisis in 2008, asset classes became increasingly correlated, and that phenomenon has continued to this day. Most asset classes generally moved up in tandem approaching the credit crisis; most asset classes moved down together as the credit crisis unfolded; and, broadly speaking, most asset classes have continued to move in lock-step ever since. In order to truly diversify and hedge downside risk, it is important to add uncorrelated assets to a portfolio whenever possible. It is within this framework of portfolio construction that the addition of the currency asset class may provide excellent potential. Currency investments have historically exhibited very low correlation to many other asset classes.
The effect of many non-profit seeking participants in the currency market may enhance the uncorrelated attribute of the asset class. For example, multi-national corporations might contract to buy or sell certain currencies for the primary reason of hedging against currency risk on future earnings or expenses in a certain country; governments and central banks are active in managing foreign currency reserves; even tourists are active currency market participants – when tourists spend money on souvenirs, food or any travel related expense in a foreign currency they influence the price of that currency, even if they are unaware of it. Such non-profit seekers can have substantial influence on currency price movements and valuations. The effect of these entities’ actions can cause currency prices to move in directions that are largely uncorrelated with most other asset classes.
Additionally, many currency investment strategies are aimed at profiting from trends that are completely unrelated to other asset classes, and therefore also generate return series that are uncorrelated to other asset class returns. An often overlooked attribute of the currency asset class is that when an investor purchases one currency, the investor is also, by implication, selling another currency, as currencies always trade in pairs. Therefore, the return generated from a currency pair is likely to differ from, and be uncorrelated to, returns of the broad stock market; which is turn adds an effective hedge to a portfolio.
Additionally, many currency investment strategies are aimed at profiting from trends that are completely unrelated to other asset classes, and therefore also generate return series that are uncorrelated to other asset class returns. An often overlooked attribute of the currency asset class is that when an investor purchases one currency, the investor is also, by implication, selling another currency, as currencies always trade in pairs. Therefore, the return generated from a currency pair is likely to differ from, and be uncorrelated to, returns of the broad stock market; which is turn adds an effective hedge to a portfolio.
Friday, May 13, 2011
Return vs. Yield
A year or so ago, I remember having a discussion with a former colleague about the performance on a certain mutual fund. As we were going over the numbers on the fund’s fact sheet, he finally asked me, “So what is the difference between annual return and yield?” Being that he had worked as an advisor for a major brokerage firm for many years, I initially thought he was kidding. But by the puzzled look on his face afterwards, I quickly realized that he truly had no idea. Without poking any fun, I explained it to him as simply as I could.
Since then, I have had other clients ask me the same question. As advisors, we use the two terms often and I think people sometimes believe that a portfolio’s annual return and a portfolio’s yield are both one and the same thing. This is not the case. Although each can be used to describe the overall performance of an investment or portfolio, the two terms differ in regards to specific time periods, (the past and the future).
“Return” expresses what an investor has actually earned on an investment in the past. This includes capital gain, interest, and dividends combined. “Yield”, on the other hand, just focuses on what the investment will pay the investor in the future. So, if you own a portfolio of stocks and bonds that is yielding 3%, but earned you 8%/year over the last decade, you know two things.
1. the total of all capital gains, interest, and dividends over the past decade averaged out to 8%.
2. if you continued to hold the portfolio unchanged for one year, you will earn 3% of interest and/or dividends of what the overall portfolio value is at that moment in time.
In looking backwards, the yield the portfolio generated in the past has already been calculated into the 8% return the investor has seen. But in looking forward, you can only calculate what the yield will be, (based on the current value of the portfolio and the amount of income the portfolio is expected to pay). We have no idea what the value of the holdings in the portfolio will be in the future. But we do know what those holdings will pay us if we continue to hold them. If we end up holding that same portfolio for another year and the price of the securities goes up another 10%, the return would end up being 13% on the year, (10% gain + 3% yield = 13%). Understanding this concept becomes important when looking at certain investments, (stocks, bonds, mutual funds, exchange–traded funds, etc). Knowing what a portfolio has earned in the past and knowing what the portfolio will yield in the future can certainly help investors make smarter, and more informed decisions.
Friday, May 6, 2011
The Sky is Falling...
As it has been said, what goes up must come down…this past week silver experienced a free fall as the precious metal dropped from almost $48.50 to roughly $34 in one week – a drop of over 30%. The silver market witnessed “parabolic downside turbulence”. This dynamic happens when a sharp rise in a short period for no reason other than investors falling over each other to buy; is followed by a swift and sharp sell off as investors fall over each other to sell.
Much of the sell-off in silver was attributed to tougher margin requirements for speculative traders. The Comex exchange had raised trading margins on silver contracts for the third time in two weeks. Comex said this week that the minimum amount of cash that must be deposited when borrowing from brokers to trade silver futures will rise to $16,200 per contract at the close of business yesterday, from $14,513. A year ago, the margin was just $4,250. There was also news that one of the biggest silver bulls in the world, Eric Sprott of Sprott Asset Management, had started selling 35 million shares of Sprott Physical Silver Trust (PSLV), a silver-based ETF.
Back in the 1970’s the Hunt brothers of Texas tried to corner the market in silver. Back then, after futures rallied to a record $50.35 an ounce in January 1980, prices dropped 78 percent in four months and wasn’t until this past week that prices got even close to that level.
Back in the 1970’s the Hunt brothers of Texas tried to corner the market in silver. Back then, after futures rallied to a record $50.35 an ounce in January 1980, prices dropped 78 percent in four months and wasn’t until this past week that prices got even close to that level.
Overall, silver has gained more than 145% in the past year, and 20% in April alone. Unlike gold, which is typically bought and held by large investors and central banks, silver is dominated by individual investors and hedge funds looking to capitalize on the hot play du jour. It will be very interesting to see if silver follows the same path that it did after the peak in 1980.

Friday, April 29, 2011
Quarterly Update
The market volatility which was missing back in the last quarter of 2010 into the first few months of 2011 came to visit in March as an unexpected earthquake and devastating tsunami in Japan, along with continued tensions and unrest in the Middle East sent global markets lower. In just two and one half weeks, the S&P 500 lost 7%, while global markets declined even more. In the subsequent two weeks the markets surprisingly recovered fueled by in-line or better than expected economic data. The Federal Reserve continued its quantitative easing program increasing liquidity into the system; which has been finding its way into commodities; as the price of oil and soft commodities continued to rise during the quarter.
Amidst the natural disasters and geopolitical unrest, the S&P 500 ended the first quarter up 5.4%, excluding dividends. Within the market, small caps outperformed large caps and the US Energy sector led with an impressive 16.8% rise amid political tensions in the Middle East. Energy stocks have now gained almost 40% in the past year. Developed markets outperformed emerging markets and Europe finished up 4.5%. Fixed Income underperformed equities due to fears of inflation and rising interest rates. Treasuries were basically flat, while high yield, (+3.9%), preferreds, (+3.6%), and TIPS , (+2.1%), did the best.
The Federal Reserve Board continues a very aggressive monetary policy. At some point in 2011 this will likely change and recently there has been a growing minority of those on the board that QE2 should be halted on schedule at the end of June of this year. With the exception of Thomas Hoenig, no calls for an actual interest rate hike have been made. If the Federal Reserve does end QE2 on schedule (which it indicated it plans to do), it is possible the end to this policy could bring increased volatility to the markets as investors try to understand the implications to the economy moving forward; given the Fed has provided ongoing liquidity and support to the monetary system for well over 2 years and to the tune of almost $2 trillion.
Our current assessment is that the US stock market averages (based on S&P 500 index) are priced close to fair valuation given current earnings estimates and the possibility of future interest rate hikes, which lowers the amount investors are willing to pay for future corporate earnings. Earnings estimates have remained steady over the past several weeks, despite the earthquake in Japan and issues in the Middle East. As of April 1, 2011, earnings estimates were $97.00 for the full year ending December 2011, a 15.8% increase over final 2010 earnings of $83.77. Applying a price-earnings ratio of 13 and 14 to expected earnings for 2011 translates into a value of 1261 (based on 13) and 1358 (based on 14) for the S&P 500. The S&P 500 ended the first quarter at 1326, right in the range of fairly valued. If expectations for higher interest rates don’t materialize, it is possible the markets could trade higher (higher price-earnings ratio) as investors will be willing to pay more for future corporate earnings.
Subscribe to:
Posts (Atom)