Friday, September 30, 2011

What Is Happening?

The number one question we usually get asked (at least lately) is "what is going on with the markets?"  Although a simple question, it's actually a really good question.  In an environment where we continue to see massive upside moves followed by massive downside moves as well as very large intraday swings - both in domestic markets and those around the globe.

We believe there is a simple answer.  Right now there are just too many outside influences and external factors playing on the collective emotions of market participants.  Here is what the last month or so has sounded like:

  • We will default on our debt if the debt ceiling isn't raised.
  • Greece is saved...no it's not...it's saved...maybe not...
  • Germany is going to leave the Euro.
  • Italian banks are in big financial trouble.
  • The Fed is going to do this...the Fed is going to do that...
  • The US economy is slowing down.

In over 20 years in the business, I have never seen such market interference and involvement by governments on a day to day basis.  One government leader states one thing, another government leader says another, and then our government leaders say something completely different.  Until this dynamic changes, we should expect more of the same.  The longer the dynamic continues the worse it is for the capital markets and world economies.

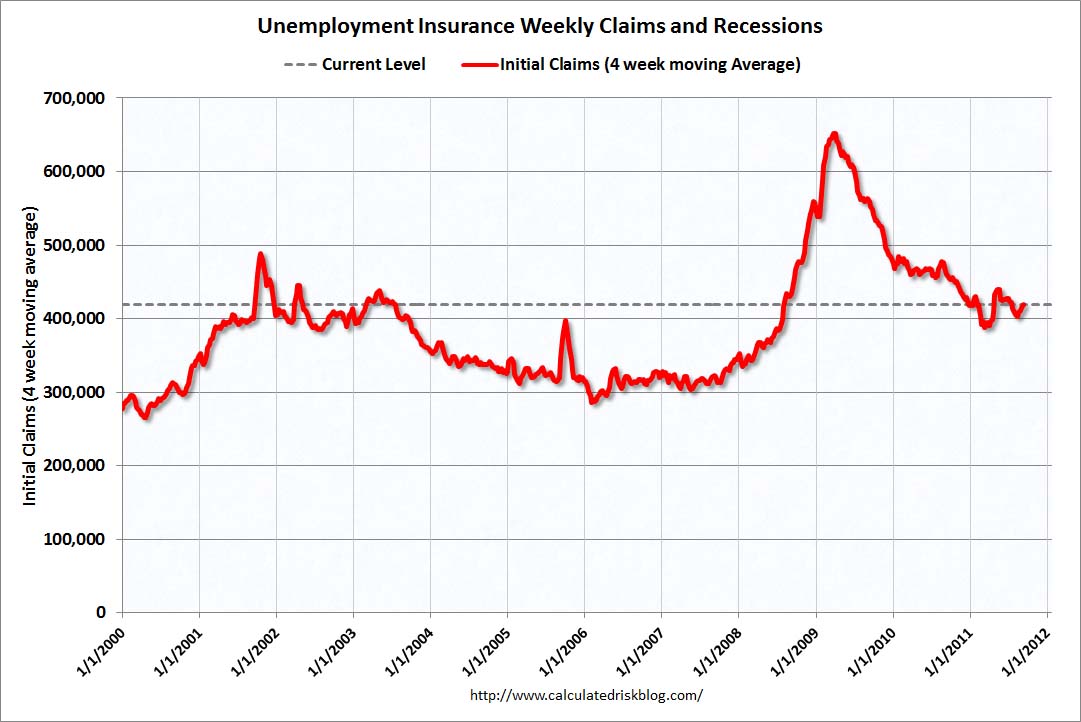
The good news is that eventually, when all is said and done, the global markets will eventually move in the direction they intended to go - which unfortunately in our opinion may be lower, as the increase in volatility is making investors more nervous and economic data continues to show a slowdown in global growth.  Just this morning the ECRI stated on CNBC that its indicators were saying the US is heading into another recession.  And this group has been very accurate in the past.  The video clip can be viewed by clicking on the link below.

http://www.businesscycle.com/#


It our opinion it is best to continue to be defensive oriented and wait until there is more clarity on both the government involvement as well as economic front.


Friday, September 23, 2011

Weekly Update


Below is excerpt from recent market commentary from the managers of the Marketfield fund.

US economic data remains squishy, but not as straightforwardly weak as consensus imagines. Perhaps most importantly non-financial earnings continue to produce positive surprises with a number retail and technology stocks reporting better than expected earnings in recent days. The Federal Reserve Board however seems to have capitulated to the fears of downside pressure issuing a decidedly downbeat statement on Wednesday that unnerved the US equity market.

As to their decision to intervene in the long end of the treasury curve this was expected but is unlikely to have a significant effect other than possibly collapsing the wide spread between the 10 and 30 year bond. As we have stated before, US monetary policy is already extremely stimulative and further embroilment of the Federal Reserve into the yield curve was an unnecessary complication. No doubt the well meaning members of the FOMC felt the need to be seen to be doing something, and at least have chosen a path that is unlikely to make matters worse.

Even after the abrupt decline on Wednesday afternoon the SPX remains in the middle of its trading range and with the exception of financial stocks, a large number of which made new post 2009 lows, most sectors remain well above key support although some may end up testing this during what looks to be a difficult week for stocks. The Nasdaq Index continues to look much better and actually broke above its 200 day ma before being pulled lower on Wednesday.

Even so the index remains in positive territory for 2011, and is the only large global index to be able to make this claim. The out performance by the NDX remains the most interesting aspect of the long corrective phase and we would be building positions in this index during the current pullback. The small cap Russell 2000 index has shown none of the defensive qualities of the larger cap indexes and we would be avoiding this area of the US equity market.

This takes us to Europe, where a hurried announcement regarding the provision of emergency US Dollar auctions last Thursday at least bought some time for the beleaguered institutions that were at risk of being choked out of funding markets. Unfortunately the first week has been frittered away without other progress being made other than a widening of collateral accepted by the ECB. The danger of a further sharp dislocation by the market has not been averted by either of these moves and a far more radical change of tack is still urgently required. The only question in our minds is whether a narrow portion of the US equity market can start to detach itself from Europe's woes and start to make steady progress in the absence of a solution being hammered out across the Atlantic Ocean. This seems unlikely if things are allowed to proceed to a full-blown crisis, but a longer process of muddling through could potentially create some great opportunities in a number of US sectors.

Friday, September 16, 2011

Unemployment Rate Shows No Improvement

State unemployment rates were generally little changed in August. Twenty-six states and the District of Columbia reported unemployment rate increases, 12 states recorded rate decreases, and 12 states had no rate change, the U.S. Bureau of Labor Statistics reported.

Nevada continued to report the highest unemployment rate among the states, 13.4 percent in August. California posted the next highest rate, 12.1 percent. North Dakota registered the lowest jobless rate, 3.5 percent, followed by Nebraska, 4.2 percent.

New Mexico registered the largest jobless rate decrease from August 2010 (-1.9 percentage points). Four additional states reported smaller but also statistically significant decreases over the year: Oklahoma (-1.4 percentage points), Indiana (-1.3 points), Oregon (-1.1 points), and Florida (-0.9 point).  Forty-five states recorded unemployment rates that were not appreciably different from those of a year earlier.

The fact that 45 states and the District of Columbia have seen little or no improvement over the last year is a reminder that the unemployment crisis is ongoing and could be for some time.

In related news, the Department of Labor stated that in the week ending September 10, the advance figure for seasonally adjusted initial claims was 428,000, an increase of 11,000 from the previous week's figure of 417,000. The 4-week moving average was 419,500, an increase of 4,000 from the previous week's revised average of 415,500.  See chart below -


Friday, September 9, 2011

Bubble Comparison Chart

Over the course of the past 30 years, the world has seen several "bubbles" emerge.  Below is a chart we call a "bubble comparsion" chart.  The chart compares Japan's stock market bubble in the 1980's, the technology stock bubble in the US in the late 1990's, China's stock market bubble of 2007, crude oil bubble of 2008, and the current state of gold in 2011.  We offer this chart so you can see what happens on the other side of euphoria.

Ironically, a recent Gallup poll shows that over 35% of Americans believe gold is the single best long term investment for the next decade; higher than real estate, stocks, bonds, and savings accounts.  Although not referenced on this bubble chart, would you like to guess what 38% of Americans believed was the best long term investment in April of 2007?


Real Estate.  It is truly amazing how often history repeats - just never in the exact same way.